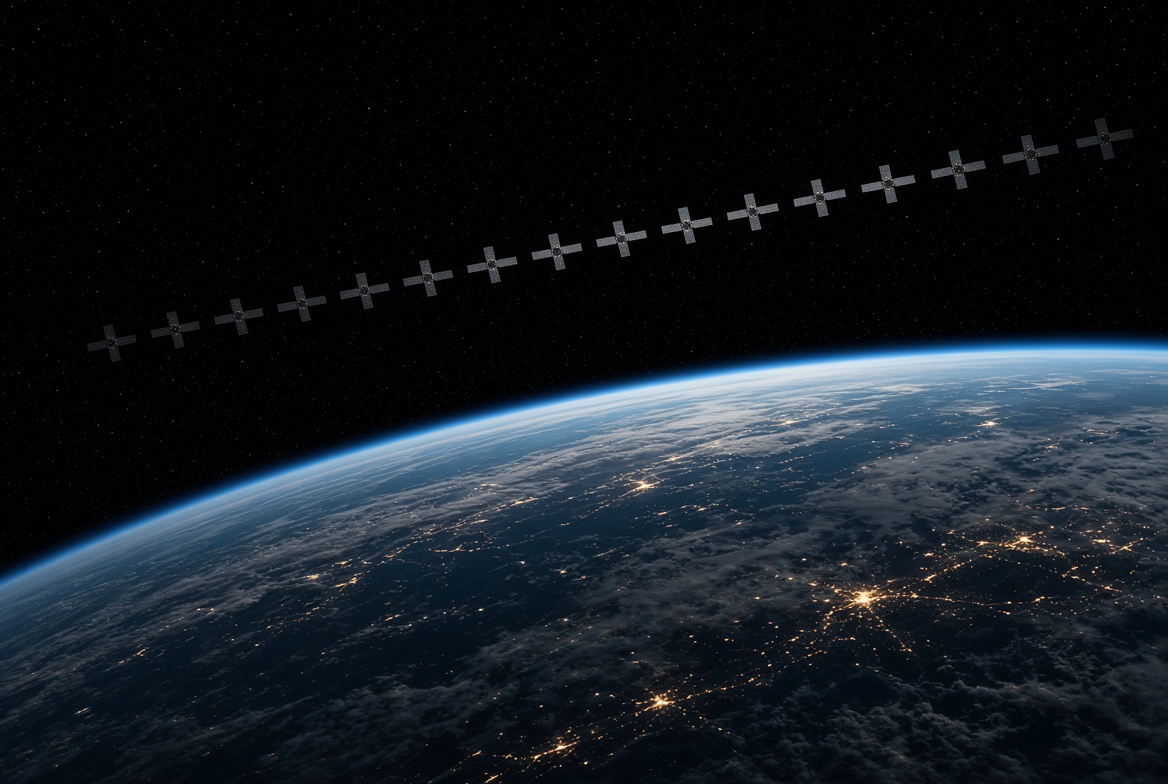


A team at Kyoto University has used a broadband satellite network to do something it is not designed for: measure the air hundreds of kilometres above our heads. By studying publicly available orbital data from around 1,200 Starlink satellites, the researchers produce the first two-dimensional map of the thermosphere, one of the least understood layers of the atmosphere. The work, published in Earth, Planets and Space, is now drawing wider attention as an example of existing infrastructure being repurposed for science.
The layer nobody can see
The thermosphere stretches from roughly 100 to 1,000 kilometres above the surface. It is extremely thin, but it is not empty. More than 99 percent of the gas at this height is electrically neutral, which makes it hard to observe. Charged particles in the ionosphere disturb radio signals, so scientists can track them from the ground. Neutral gas leaves almost no trace. Until now, researchers rely on models, or on instruments carried by a small number of dedicated satellites that only sample the air along their own paths.
Yet this faint gas matters. Every satellite in low Earth orbit pushes through it, and the resulting drag slowly lowers the spacecraft. When the Sun is active, the upper atmosphere heats up and expands, and the drag increases.
Broadband as a sensor network
The Kyoto team, led by Mamoru Yamamoto, treats that drag as useful data rather than a nuisance. SpaceX publishes detailed position and velocity information for its Starlink fleet. By tracking how much orbital energy each satellite loses, the researchers estimate the density of the air around it. With 1,200 satellites at about 482 kilometres, they have enough points to apply tomography, the same mathematical technique used in medical CT scanning, and build a picture of density across latitude and longitude.
The result agrees closely with independent measurements from the European Space Agency's Swarm satellites, which is an encouraging sign that the method works. It builds on an earlier study by the same group, which uses simpler orbital data to track density over time and height. The new map adds the horizontal dimension.
Why it matters
The clever part is the economics: nobody has to launch a new instrument. The satellites already exist, the data are already public, and the constellation covers most of the planet at once. Yamamoto describes the project as a meeting point between space science and space engineering, fields that rarely talk to each other.
The practical benefit is safety. Low Earth orbit is becoming crowded, and better knowledge of atmospheric density improves predictions of where satellites and debris will be. That helps operators avoid collisions.
What comes next
The researchers describe the work as an initial report, a first snapshot rather than a finished tool. The next steps involve refining the technique and testing it under different levels of solar activity. If it scales, near-real-time monitoring of the upper atmosphere becomes possible, with gains for space weather forecasting. Whether other operators open their orbital data in the same way remains an open question, and one that shapes how far the approach can go.